

Petrophysical characteristics from analysis of SEM images (PSEMIA)
(На русском: Петрофизический анализ SEM-изображений)
PSEMIA method is actualized as software for IBM PC, which analyzes SEM-images of sedimentary rocks of all genetic types (grain size from psammites to pelites inclusive), irrespective of any other characteristics or conditions that could prevent determination of the following petrophysical parameters:
- Total porosity
- Static and dynamic porosity
- Producible porosity
- Median pore aperture (pore-connection)
- Permeability (corresponds to gaseous)
- Average pore size
- Coefficients representing pore shapes
- Differentiation of system on 11 pore types
-
The program allows you to:
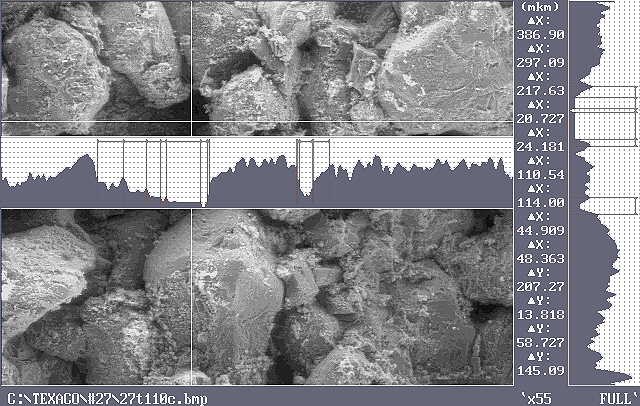
- to split the original 256-level image into 14 (or less) levels according to the surface structure, with the type of transformation set manually or automatically;
- calculate statistical characteristics of the original and transformed image;
- display these images in gray, color and inverse palette;
- build z-coordinate profiles of these images and display them on the screen.
-
Properties of the MS-DOS program itself:
- Supports multilingual interface (russification is built-in).
- Allows you to change the fonts used (supplied with the program).
- Contains context-sensitive detailed assistant and detailed diagnostics of abnormal situations.
- It has a system of customization of work parameters and external design.
- Contains a built-in notepad and calculator.
- Uses direct access to hardware, so it does not work on WinNT platform.
- Prefers maximum free lower memory (620Kb), but can work on 450Kb, in which case it automatically creates its own swap file and uses part of the disk as a RAM area.
-
The following data can be obtained from the analysis:
- Number, areas, pore roughness and sphericity coefficients and average pore size; average pore aperture; total, dynamic, static, productive and unproductive porosities; and major pore type and permeability.
- Pore information separately by 11 groups (mega-, macro1-, macro2-, macro3-, meso1-, meso2-, meso3-, micro1-, micro2-, micro3-, and crypto-).
- Analyzed image as painted regions according to pore types.
- For the whole sample as a whole in the form of:
- graphs of distribution of the number of filtration channels and their corresponding pore area from their diameters.
- histograms of distribution of relative occupied area and number of pores by groups.
- graphs of distribution of roughness and sphericity coefficients of pores by groups.
Objectivity of generation of topographic structure of 3D surface in PSEMIA method is justified by compatibility of results of analysis with conventional methods of petrophysical measurements.
Major advantage of PSEMIA software is the possibility to obtain many numeral characteristics of reservoir quality from one sample of core or cuttings.
Low available illustrations for this method, also see detailed Presentation of PSEMIA-method.
-
Results are represented as ready images, colour graphics and text files:
- Chart of pore aperture
- Histogram of pore group distribution
- Curves of pore shape factor
- Table of pore characteristics
For more information please contact with autors:
Azer Iliyev, researcher ("iliazer@mail.ru")
Erikh Gauzer, programmer ("heh@vgd.name", website: "erichware.info")
Subject of e-mail is "Image analysis".